
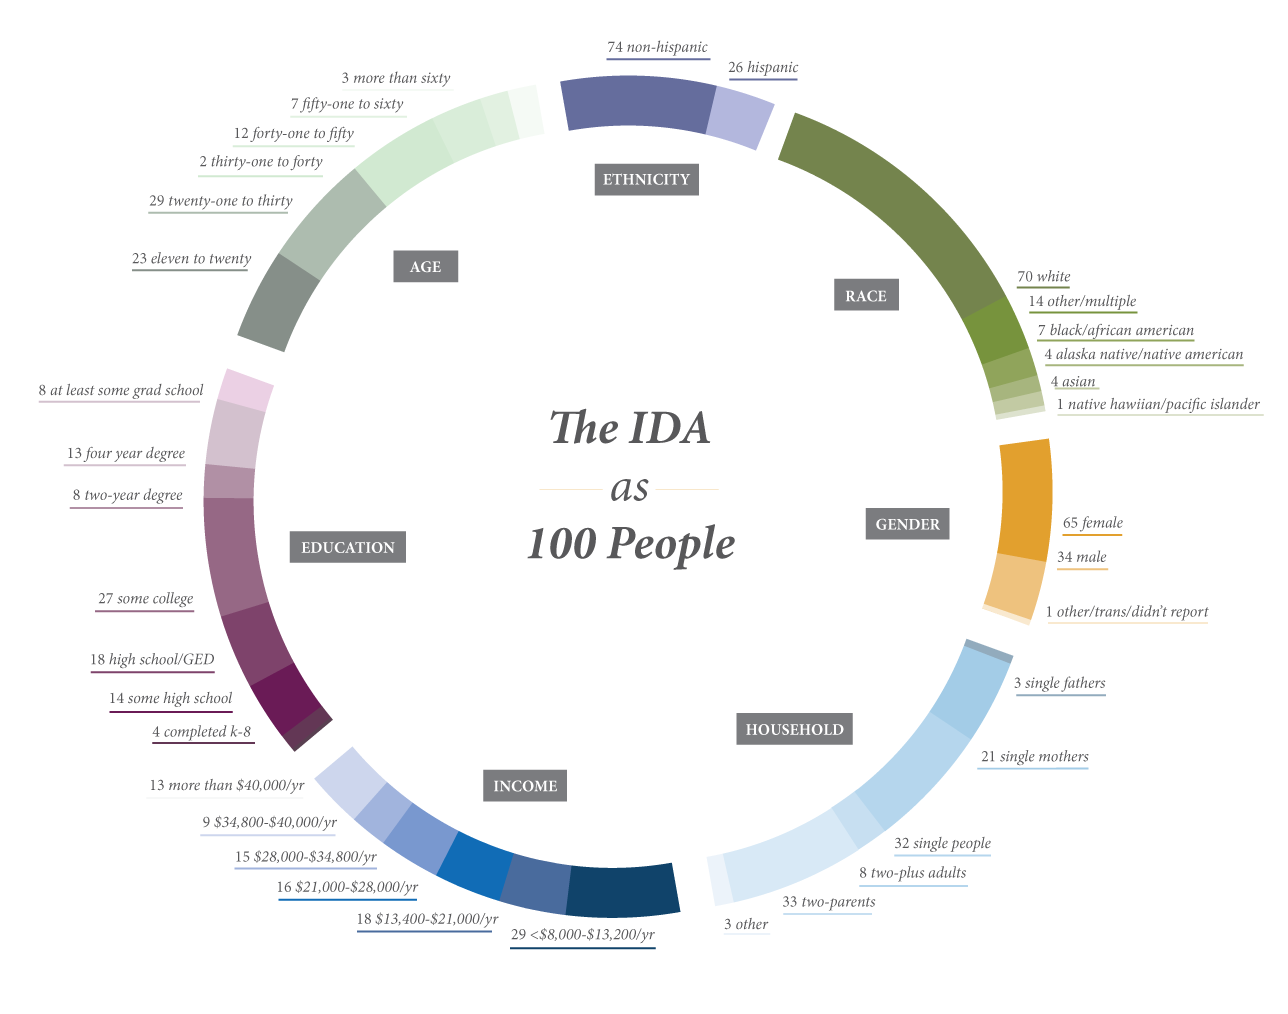
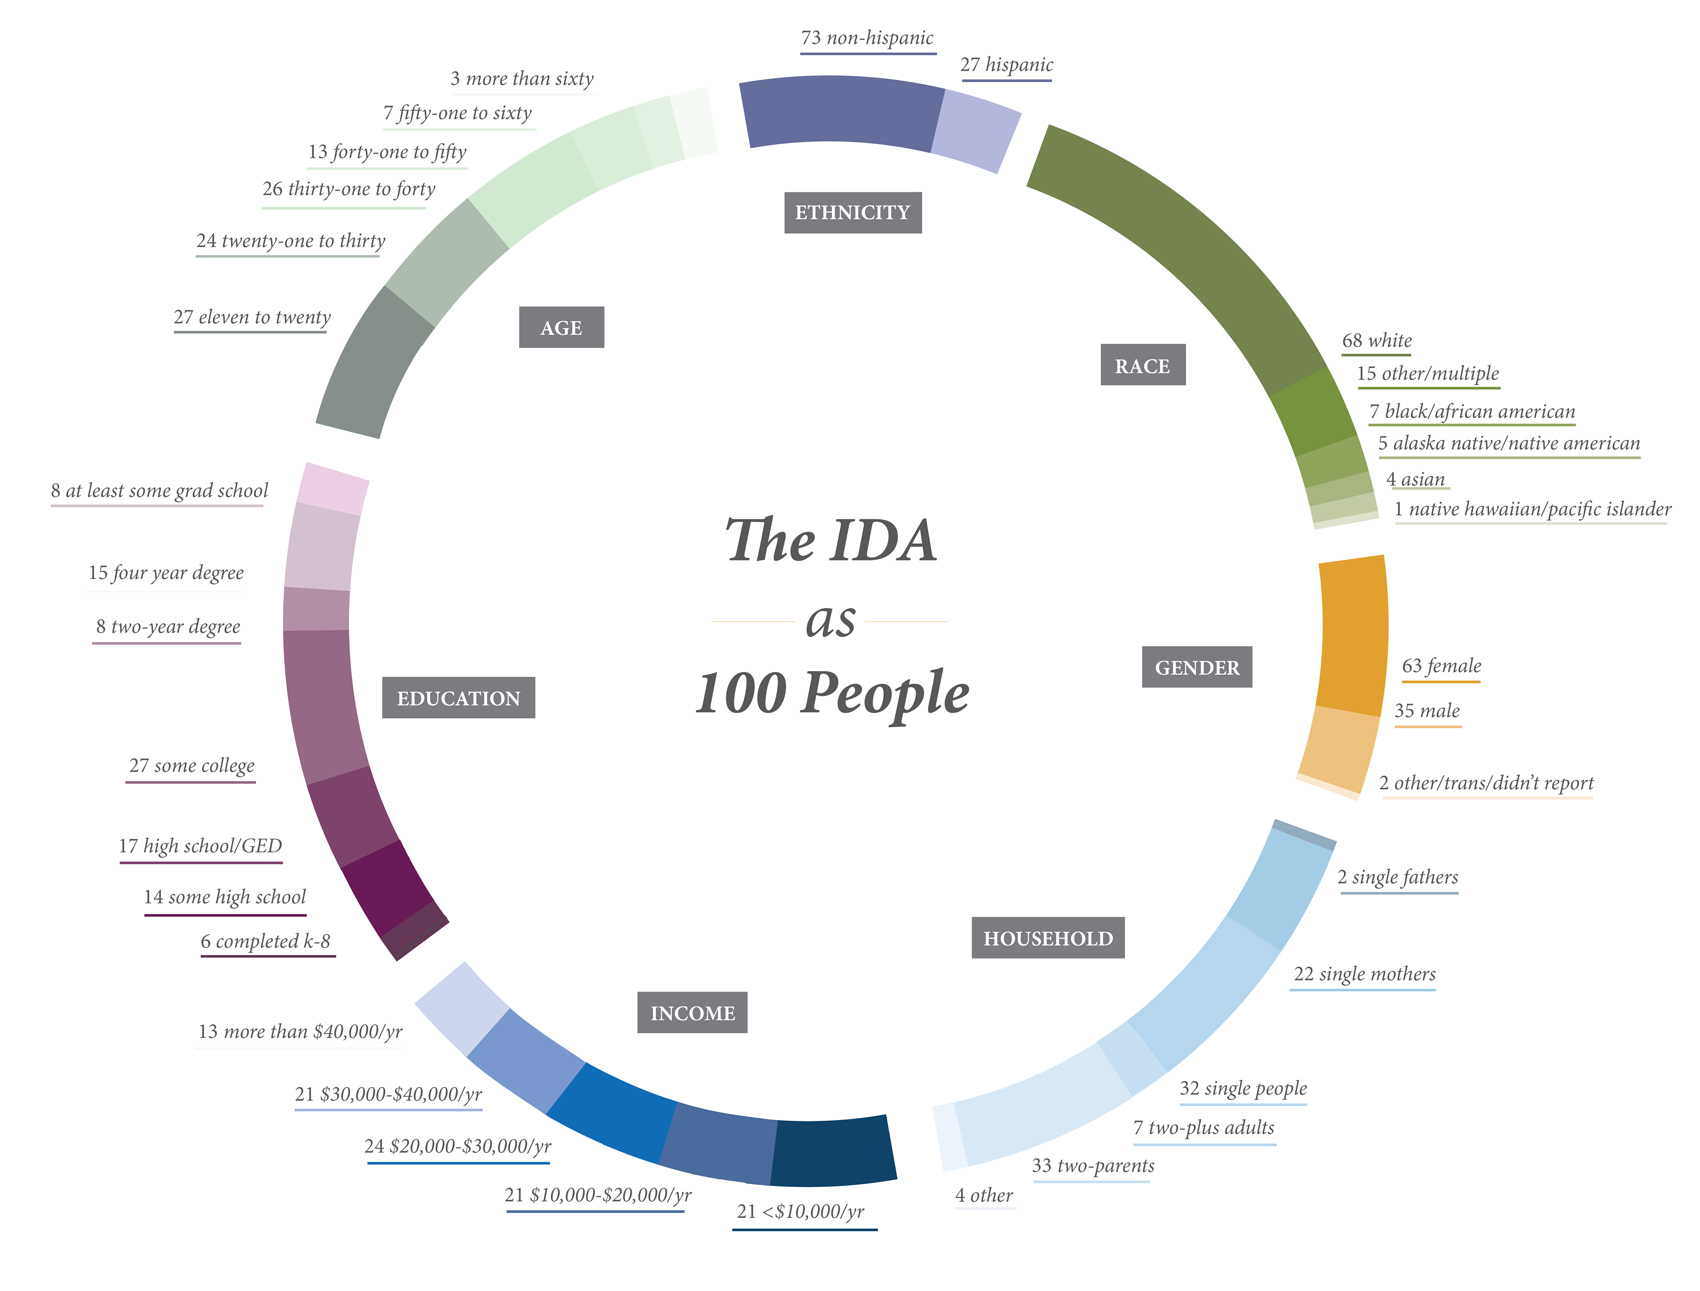
Neighborhood Parnterships researched and gathered data on the 2016 Oregon IDA participants. Check out the infographics below showing what they found.
Demographics
Reach
![OR-USA-113061 [Converted]](https://oregonidainitiative.org/wp-content/uploads/2015/01/OregonIDAheatmapv2.jpg)
Impact

Savings Category Distribution
[button_1 text=”Download%20the%20PDF” text_size=”18″ text_color=”#ffffff” text_bold=”Y” text_letter_spacing=”0″ subtext_panel=”N” text_shadow_panel=”N” styling_width=”20″ styling_height=”20″ styling_border_color=”#000000″ styling_border_size=”1″ styling_border_radius=”6″ styling_border_opacity=”100″ styling_gradient_start_color=”#e19e2f” drop_shadow_panel=”N” inset_shadow_panel=”N” align=”center” href=”https://oregonidainitiative.org/wp-content/uploads/2015/01/IDA_Stats_Onepager_Feb17v6.pdf” new_window=”Y”/]